RGGI and California Cap and Trade Programs
- changinggrid
- Dec 11, 2017
- 3 min read
President Donald Trump has done something, yet again, that most of us would not have imagined. Mr. Trump withdrew the U.S. from the Paris Climate Accord and is threatening to destroy the environment. The President has claimed that climate change is a hoax and has appointed climate skeptics to his administration like Scott Pruitt to the Environmental Protection Agency. Time and time again, Trump continues to let down his son Barron who will live in a world much longer than his father. Barron will have to live in a world with cataclysmic events like super storms, flooding, and fires on a daily basis. You may be asking yourself by now, what does the above rant have to do with RGGI or California Cap and Trade Programs? It has to do with the fact that the future for climate policy is hopeless if we as an individual, family, community, state, country, or world do not begin to turn things around now.
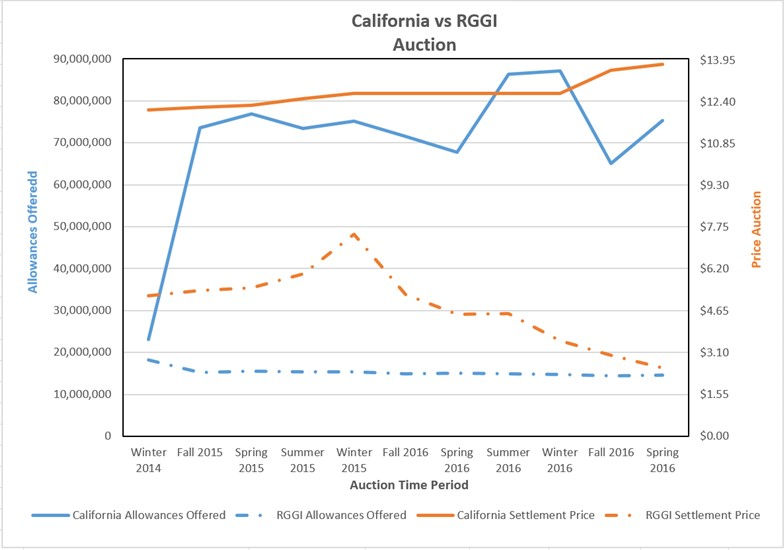
There is a glimpse of hope though. The Regional Greenhouse Gas Initiative (RGGI) “is a cooperative effort among the states of Connecticut, Delaware, Maine, Maryland, Massachusetts, New Hampshire, New York, Rhode Island, and Vermont to cap and reduce CO2 emissions from the power sector.” The California Cap and Trade Program covers: “electricity generators and large industrial facilities emitting 25,000 MTCO2e or more annually; and distributors of transportation, natural gas, and other fuels.” The California Program has also linked with the Canadian province of Québec to help reduce the mitigation costs in complying with CO2 emission reductions. While both of these programs plan to reduce CO2 emissions, there are different designs behind each of these two programs. Below is a graph examining the differences between the allowances offered in the two programs.

One allowance is equivalent to one metric ton of CO2 emitted. California has far more allowances offered to cover its wide reaching program compared to RGGI, which only covers its electric sector, and has a far higher settlement price, which is the price at which the allowances sell for. When the two programs are compared over time, as below, there is far more volatility.

California’s reserve price increases annually 5% plus the rate of inflation and RGGI’s reserve price increases by 1.025 multiplied by the minimum reserve price from the previous calendar year. However, both of these prices are the floor, meaning that the price in the auction can go above this amount as seen in the chart above. The price floor allows the settlement price to not bottom out and prevents California or RGGI from giving allowances out for free. For 2017, the reserve price is $13.57 in California and $2.15 in RGGI.
Why are the two carbon markets so different? California covers a far greater percentage of the emissions in their regional economy and therefore, their auction allowances are far higher. California also places a higher social cost on a metric ton of CO2 that is equivalent to the damages on infrastructure and the environment. In order for these two markets to integrate, the reserve prices need to equal the damages caused by CO2 pollution. Three economic models have tried to predict these damages including the DICE model (Yale University), FUND model (Sussex University), and PAGE model (Cambridge University). In 2015, the Interagency Working Group on the Social Cost of Carbon, which has been disbanded by Trump, combined these three models and found that the average social cost of carbon (SCC) estimate, with a 3% discount rate, was $40.
Clearly, the California Program and RGGI have a long way to go in hopes of integrating and internalizing the damages from CO2. If these programs can, however, do this, the future of the U.S. commitments, policies, citizens and the environment will have hope.


Kommentare